Stock Market: Volatility Takeover
Share

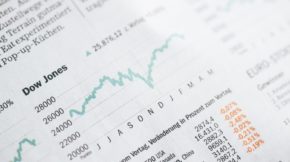
History has been written on Monday, February 5, 2018 where the Dow Jones Industrial Average (DJIA) plunged 1175 points, the biggest one-day selloff in its lifetime. But what caused this drop-in price? And is this a hint at a bigger drop soon? This massive intraday selloff caused the DJIA ending the day with a drop of nearly 4.5%.
In the same week, on Thursday, February 8, 2018, we had seen the DJIA drop another 1000 points from open. Another day with over a 1000-point selloff, all in the same week, has Wall Street worried with the major volatility the markets have been producing.
DJIA
This 30-stock index started trading slowly on the morning of February 5, very typical behaviour. At 3pm EST, investors experienced the 2010 flash clash right before their eyes. Dow plunged more than 700 points in the last hour of trading which drew attention all over the world. Investors panicked, markets around the world did not know what happened and how to react with the biggest DJIA intraday selloff.
Similarly, on February 8, we had seen the same situation. The markets trending down for the day and hitting the days low during the last hour of trading. At the end of day on the 8th, DJIA was down 10% from its all-time highs and crushed its YTD gains. We can see in the chart below of how big the candlesticks appear lately than how the markets performed early in the year, when it created new all-time highs. These big candlesticks contained immense volume carried throughout the week, putting the markets around the world in a position where going long didn’t seem like a good option.

Many other indices and markets around the world had reacted to the historical move. Let’s take a look at how markets overseas and similar indexes reacted to the plunge.
Nasdaq

Similar to the Standard & Poor’s 500 (S&P 500) and DJIA, the NASDAQ index is an index of the common stocks and securities that are listed on the NASDAQ stock market. This index gives us an overall summary of how the stock market has been doing. Indices are typically a weighted average of all the stocks listed under the respective index. Looking at the chart, we can see that this looks almost the same as the DJIA chart above. How the index performs give us the general view of how the stocks have been performing and, in this case, it was not at all good. Behind this price action, these indices experienced major volatility during the day. The news that were to blame for these drops in prices in American markets were clearly not taken as a positive sign for the American economy. During this time, even earnings data and economic events that took place were not enough to keep the prices above the correction territory.
VIX
Formally known as the CBOE Volatility Index, VIX, is a measure of the volatility that is directly implied by the S&P 500 index. Calculated by the Chicago Board Options Exchange, VIX is a very popular measure of volume of the S&P 500 which informs us of how much the market will move in the near future. A high reading on the VIX chart tells us that markets have become unstable. In other words, there is a significant amount of risk held in the markets and this pressure in the markets will diminish when we see a sharp move in the markets, either to the upside or downside. This is exactly what we had seen on the VIX during the week. Major volatility took place in every index, and since VIX showed drastic movements, we saw that S&P 500 also took a hit.

See how the VIX performed before this drama had erupted the markets and how it looks now with the plunges in the indices. This major upside and downside we see in the candles clearly informs us of a sharp move that occurs in the markets. Reaching as high as 51.3 and as low as 16.8 this week so far, we had seen how this directly implies the sudden move we had seen in the indices. This major volatile drama puts money at risk and gets ready for a big move in the markets.
Markets Around the World
What occurred on February 6&8 with the DJIA had major effects on the markets overseas. The image below shows overseas markets closing with a loss, before entering the weekend. This loss follows the second DJIA drop of 1000 points on February 8.

We see that markets around the world took huge hits, some even falling around 3% as they opened after the second DJIA plummet. This surge in volatility worldwide called for major risk in the markets for majority of the securities.
Why and What Happened
The big question is why this happened. Why did DJIA lose 1000 points for two days in the same week? Why was there a surge in volatility in the markets creating huge risks? The main economic factor to blame is inflation and rising federal interest rates.
Ever since the 2008 crash, the American economy has been growing steadily. With the rise in stock prices, this economy has been stronger than ever. These price increases in shares have increased at a high rate during the last 8-10 years, without any major correction in the markets. Typically, on average, we see at least one correction each year.
With rising inflation comes the rise in federal interest rates. Over recent years, the Fed hesitated to increase the rates since they thought this would affect the market recovering from the 2008 crash. Higher rates cause more money to flow out of corporations and into the hands of the government. With money flowing out of the businesses, this cuts profits and eventually driving the stock price down.
One reason that has been in the shadow of all this ruckus is the bond yields hitting a four year high on February 8 when the DJIA fell another 1000 points. In recent times, the bond rates had been low, causing them to provide a return that is less than what most company dividends pay. This rise in the rates calls for a safer investment than stocks. If bonds are now a safer investment, investors would likely cash out of the stock market and start making in the bond market, while having a diversified portfolio. These attractive yields will draw more attention in the near future.
Recovery or Crash?
We have seen the market fall more than ever and people are already questioning whether this selloff will continue or are we experiencing a market correction of around 10%? Market corrections occur at least once a year, but with the rapid upside movements in the stock market, investors expect a market correction of 10% to confirm that the market is in good shape.
A market correction is a reverse movement of at least 10% in the financial markets to adjust for an overvaluation of the prices. We had seen that on the daily and monthly charts of the various indices, the markets rapidly increased in prices, with no proper correction that took place. This recent correction of around 10% fits the definition and investors will look for an upside movement in the markets in the near future.
Specifically looking only at the DJIA, since it is the highest index in terms of price, we see that it hit lows of around $23,300 and held up a couple hundred dollars under $24,000. Now for this market correction to slowly make its way for the first market crash in years, prices of the DJIA should look to decrease rapidly with huge amounts of volume just like we saw this week. With a rapid downside movement causing the price to fall below $20,000, we may see a start to another market crash.
For now, let us wait and see what Wall Street has to think of these markets in the upcoming days.
You may also be interested in: Why Should You Trade in the Forex Market?
Writer: Saket Patel
Disclaimer: All investing can potentially be risky. Investing or borrowing can lead into financial losses. All content on Bay Street Blog are solely for educational purposes. All other information are obtained from credible and authoritative references. Bay Street Blog is not responsible for any financial losses from the information provided. When investing or borrowing, always consult with an industry professional.


Bay Street Blog Newsletter
Click here to subscribe for a financial savvy experience.
Please check your email to confirm subscription!